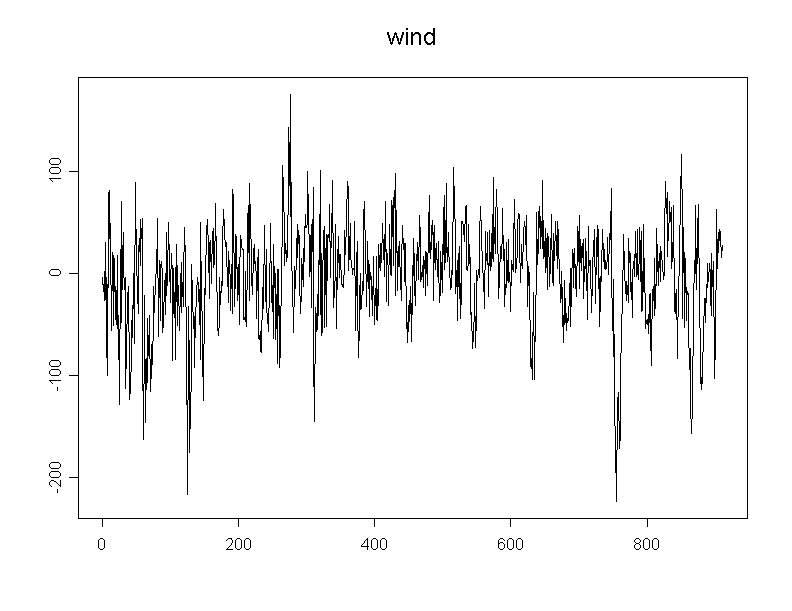
The figure is a time series plot of the ENSO meridional wind anomaly index (in cm/s) for the region 12-2N, 160E-70W. There are 910 monthly observations, from March 1920 to December 1995. More information about the series can be found on http://tao.atmos.washington.edu/data_sets/eqpacmeridwindts/.
The above article is, more or less, a shortened version of the paper Forecasting non-stationary time series by wavelet process modelling by Piotr Fryzlewicz, Sebastien Van Bellegem and Rainer von Sachs. The latter paper is available as a pdf or a gzipped ps file.
The time series is plotted below:
