


Next: Analysis of variance
Up: Contents
Previous: Interval estimation
Activity 8.1
Why does it make no sense to use a hypothesis like

?

Answer 8.1
We can see
immediately if
by calculating
the sample mean. Inference is concerned with the population from
which the sample was taken. We are not very interested in the
sample mean in its own right.
Activity 8.2
Of 100 clinical trials, 5 have shown that wonder-drug zap2
is better than the standard treatment (aspirin). Should we be
excited by these results?
Of the 1000 clinical trials of 1000 different drugs this year 30
trials found drugs that seem better than the standard treatments
with which they were compared. The television news reports only
the results of those 30 `successful' trials. Should we believe the
television news reports?
A child welfare officer says that she has a test that always
reveals when a child has been abused, and she suggests it be put
into general use. What is she saying about Type I and Type II
errors for her test?
Answer 8.2
If 5 clinical trials out of 100 report that zap2 is better,
that is consistent with there being no difference whatsoever
between zap2 and aspirin and a 5% Type I error being used for
tests in those clinical trials. With a 5% level of significance
we expect 5 trials in 100 to show spurious significant results.
If the news reports the 30 successful trials out of 1000, and
those trials use tests with significance level 5%, we may well
choose to be very cautious about believing the results. We would
expect 50 spurious significant results in the 1000 trial results.
The welfare officer is saying that the Type II error has
probability zero. The test is always positive if the null
hypothesis of no abuse is false. On the other hand, the welfare
officer is saying nothing about the probability of Type I
error. It may well be that the probability of Type I error is
high, which would lead to many false accusations of abuse when no
abuse had taken place. One should always think about both types
of error when proposing a test.
Activity 8.3
You should be able to verify that for each of these critical
regions the probability of rejecting

when
is true is

%.
Answer 8.3
When
is true,

, and so

has a standard normal
distribution. The probability of rejecting
is then the
probability of a standard normal random variable

taking values
in both tails, the left hand tail, or the right hand tail
respectively. It is easily seen that all the probabilities are

.
Activity 8.4
Why don't we use a two-tailed test for a one-sided
Alternative Hypothesis?
Answer 8.4
We do not use a two-tailed test for a one-sided alternative
hypothesis, because the two-tailed test would have a greater
probability of Type II error. It would have less power.
Activity 8.5
There is no obvious link between confidence intervals and
one-tailed tests. What sort of confidence interval would one need
to define to have such a link?
Answer 8.5
One would need to have confidence intervals of the form

, and

. The first type would just
give, say, 95% confidence that

.
Activity 8.6
Suppose that we have two independent samples from normal
populations with known variances. We want to test the null
hypothesis that the two populations have the same mean against the
alternative that the means are different. One could use each
sample by itself to write down a 95% confidence interval for the
corresponding population mean. One could reject
if those
intervals did not overlap. What would be the significance level of
this test?
Answer 8.6
Let us assume the Null Hypothesis is true, and that

. The two intervals do not overlap if and only if
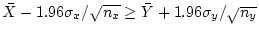
or
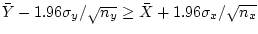
. So we want the probability
This is
We have constructed a standard normal random variable, so the
probability is
This does not reduce in general, but if we assume

and

, then it reduces to
So the significance level is about 0.6%, which is much smaller
than the usual conventions of 5% or 1%. Putting variability into
two intervals makes them more likely to overlap than you might
think, and so your chance of wrongly rejecting the Null Hypothesis
is smaller than you might expect.
Next: Analysis of variance
Up: selftestnew
Previous: Interval estimation
M.Knott
2002-09-12
![$\displaystyle P[\frac{\vert\bar{X}-\bar{Y}\vert}{\sqrt{\sigma^2_x/n_x+\sigma^2_...
...igma_x/\sqrt{n_x}+\sigma_y/\sqrt{n_y}}{\sqrt{\sigma^2_x/n_x+\sigma^2_y/n_y}}].
$](img281.png)
![$\displaystyle P[\vert Z\vert\ge
1.96\frac{\sigma_x/\sqrt{n_x}+\sigma_y/\sqrt{n_y}}{\sqrt{\sigma^2_x/n_x+\sigma^2_y/n_y}}].
$](img282.png)