Activity 9.1
Think carefully about the last Tables 9.1 to
9.3. The sum of squares identity says
that the total sum of squares from all the data in the first table
is obtained by adding together the total sums of squares of each
of the last two tables. Also, the entries in the first table are
the sums of the corresponding entries in the last two tables. We
have broken down the original grouped observations into the last
table, which reflects the group structure, and the second table,
which has numbers which look randomly distributed around zero. How
would these tables change if groups 3 and 4 were put together as
one group?

Answer 9.2
If

is large, then

, which can be thought of
as the average of the squares of
independent standard
normal variables, gets closer and closer to the expected value of
the square of a standard normal variable , which is its variance,
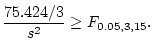
1. So the F statistic becomes effectively

, which is a

random variable with

degrees of freedom divided
by its degrees of freedom.
Answer 9.3
It does not follow that some pairwise difference of means
must be significantly different from zero. We are putting together
information from all the groups for the overall test, and it may
not be possible to isolate the significant information in any
particular pair.
Answer 9.4
Each of the

intervals has a probability of not covering
its corresponding population mean difference of

%. The
probability that at least one of them does not cover its
population mean difference is therefore no more than

%, which is

%. So the probability that they all cover
their corresponding population mean differences is no less than
95%.
Activity 9.5
Give the
interval in the simultaneous set for the contrast with
,
,
,
.
Do you notice anything that connects your interval with the
analysis of variance table?
Answer 9.5
, and
. The 95% simultaneous interval is
which is
which is
There is a connection with the analysis of variance table, because
apart from rounding errors. So we can see
that the confidence interval for this particular contrast does not
include zero because
This is precisely the condition that is used in the analysis of
variance for rejecting the Null Hypothesis that the groups all
have the same population mean. One can always find a contrast with
this property. The F-test in the analysis of variance always, in
effect, rejects the Null Hypothesis of equal group means when the
the simultaneous interval for some particular contrast does not
include zero. That contrast may, as in this example, be of little
interest in its own right.
Activity 9.6
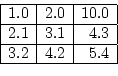
In the following table of population means, what is the
difference between means in column 1 and column 2? What is the
difference between means in row 2 and row 3? What is the
interaction for the 2

2 table of cells in columns 1 and 2
and rows 2 and 3? Does this table show an additive structure for
row and column effects?
Answer 9.6
The difference between cells in columns 1 and 2 that are in
the same row is 1.1. For instance in row 1,
column

column

, while in row 2,
column
column
.
The difference between cells in rows 2 and 3 that are in the same
column is 1. For instance in column1 1,
row  row
row  , while in column 2,
row row
, while in column 2,
row row  .
.
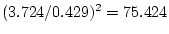
The interaction for cells in columns 1, 2 and rows 2, 3 is
This table of means has almost an additive structure, but the
large value in the top right-hand corner has destroyed it. If that
value were 3.2 instead of 10 the table would have the additive
structure.
Activity 9.7
What happens to all the sums of squares if one entry in a
data table is allowed to become very large? This is
the effect of a gross error in recording the data.
Answer 9.7
One can, of course, just try putting in a large value, and
see what happens. To get some idea without calculating, one can
see that if one entry in the table is very large, it will dominate
all the others, so one may as well imagine that all the other
entries are zero. So let's think of a table in which the top left
hand cell has a large value

and all the other entries are
zero.
The overall mean is  , the row effect for the first row is
 , and for all other rows it is -a/rc. The sum of squares
between rows is therefore
, and for all other rows it is -a/rc. The sum of squares
between rows is therefore
The sum of squares between columns is, similarly,

.
The total sum of squares is

, and the sum of squares
for error is, by subtraction,
. The F ratios for
testing whether there are population row differences and column
differences are therefore both equal to 1. So, the effect of a
single large outlier is to remove all the evidence for row and
column effects.


 Next: Least squares
Up: selftestnew
Previous: Hypothesis testing
M.Knott
2002-09-12
Next: Least squares
Up: selftestnew
Previous: Hypothesis testing
M.Knott
2002-09-12